

How to analyze tire sell-out prices in 5 steps?
Analyzing and monitoring consumer price changes in any market requires identifying and defining the business questions that this study needs to answer. First, you must ask:
-
What are the sell-out price dynamics in my market?
-
What is my price positioning in relation to my competitors?
-
On which product panel? In which segment?
-
In which geographical area? On which channel?
-
Is my profit margin preserved?
Consequently, asking these questions will allow you to define a scope. In turn, this helps select and guide the choice of data required for these analyses, whether internal or external.
Typically, external data consists of competitors’ prices collected online or in the field. Conversely, internal data can include sales volumes, sell-in prices, and profit margins. In most cases, both of these types of data are required to conduct a meaningful analysis.
Now, let’s take the case of the tire market:

Define the scope for online price collection
To correctly define a scope of online price data collection, several questions need to be answered:
What is quality consumer price data?
Fundamentally, the definition of quality price data lies in its ability to meet several criteria. First, it must precisely answer the business questions you defined beforehand. As such, when analyzing this data, the extraction of findings will be directly related to the previously mentioned issues. Second, there is the notion of confidence. This involves the origin of data (traceability), repeatability in the collection process, and the independence of the supplier in relation to the market. Indeed, a supplier cannot sell its products in the target market and simultaneously produce its own objective data.
What level of accuracy is required to provide a consistent and detailed price analysis?
Furthermore, the level of data accuracy has a significant impact on the results of an analysis. For example, the average difference in price for a tire, with or without a manufacturer’s marking (e.g., AO marking for Audi) for the same size, can vary by several percentage points. Therefore, the inability to distinguish them will distort the analysis of the average price for a specific size.
When to collect data?
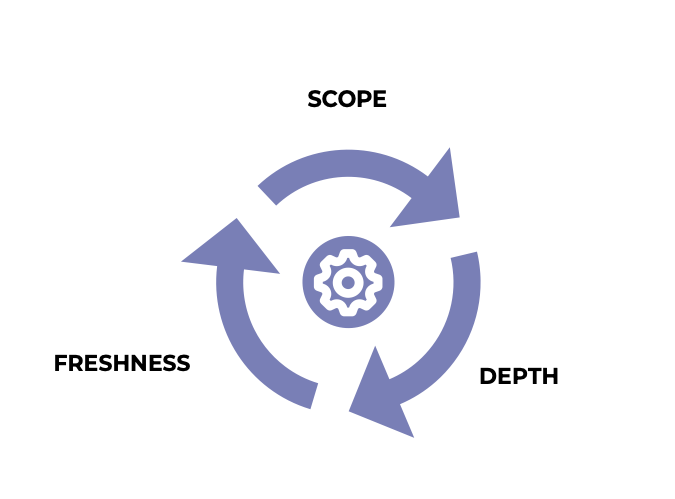
Naturally, the lifespan of price data is inherently very short. Therefore, its freshness is a criterion of crucial importance. In e-commerce, the frequency of re-pricing is very high. Specifically, it is often day-to-day in the tire industry, and sometimes on an intraday basis in other sectors. Consequently, the collection frequency is of utmost importance to obtain the most accurate analysis possible. For instance, an average price per week will be much more accurate if prices are collected daily.
What parameters are involved in the collection of online price data?
Scope
- Geographical: what country, region, states?
- Commercial websites: number, location, etc.
- Products: What brands, what product ranges?
- What segment: Touring, Truck, Motorcycle, etc.
- Sizes: 16, 17 or 18 inches
Depth
- Complete size: 205-55-R16-91V
- Technical markings: Runflat, Manufacturer Marking (OE), Rim protection, etc.
Freshness
- Collection frequency: daily, weekly, etc.
How to collect data in an automated, industrialized and controlled way?
Ultimately, the collection of online consumer price data requires the use of tools that “visit” targeted commercial websites to collect the necessary information without disrupting them. Moreover, these tools must be smart and efficient since an e-commerce website changes regularly (new design, new layout, new URL). Unfortunately, these changes have a direct impact on data collection tools, often resulting in a loss of data. To prevent this, you need a dedicated team that monitors each website daily to ensure the operational capability of the system 24/7.

Clean, match and unify data
Now, the time has come for ‘Data’ specialist expertise to come into play. Specifically, the description of a tire sold online is one of the elements that can vary significantly from one e-commerce website to another.
Generally, the list of attributes that constitute the description of a tire and which can vary includes:
-
The brand.
-
The product name, with correct punctuation.
-
The technical markings (runflat, OE Marking).
-
The tire manufacturer code.
To be able to attach the collected prices to the right tire, it is necessary to “understand” and decipher the key elements displayed. As a result, this allows the product to be identified and compared with a specific reference base of existing and validated tires. This crucial process is known as the data unification step.
Automating the Matching Process
Essentially, this referent database is the cornerstone of an efficient matching system designed to deliver unparalleled data quality. By comparing the collected data with this referent database, you can verify if the information found online for a specific tire actually exists.
Thanks to this process, data collected online can be systematically and automatically categorized:
-
Unknown product: Is it a new release?
-
Known product: Attachment of the collected price, its source, and the collection date.
-
False product: The combination of information is not possible because the product does not exist.
-
Outliers: The most outrageous prices are filtered out (e.g., a touring tire sold for less than $20 is unlikely to be real).
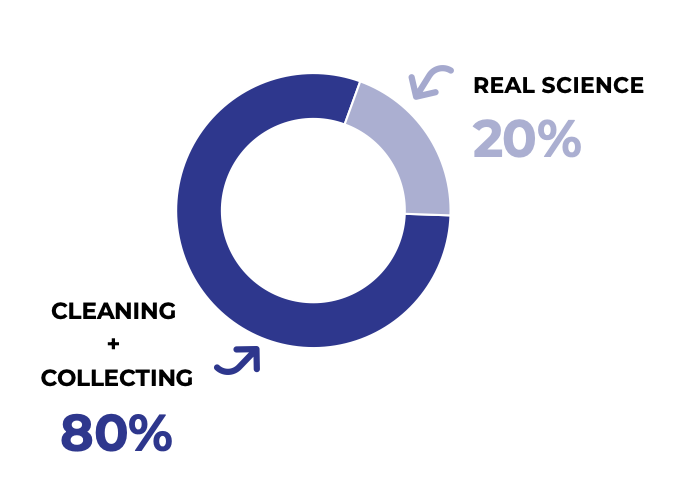
In conclusion, the combination of a highly qualitative tire database, matching technologies, Machine Learning algorithms, and product marketing expertise provides data with a high level of completeness. Ultimately, this will allow you to focus on your business analysis and gain efficiency. After all, analysts and Data Scientists typically spend between 50 and 80% of their time cleaning data before they can even start handling it!

Enhance data through tire market knowledge
In this step, the data is cleaned, structured and unified. Prices are attached to the right product, which has a unique description.
However, analysis conducted on this level of data do not yet provide sufficient accuracy.
Indeed, the segmentation of the tire manufacturer, the vehicle segment, the season, the manufacturer marking and manufacturer part number are examples of filtering and analysis elements which are of critical importance when tracking market prices. Unfortunately, not all of this data is not available online, and if present, rarely with an adequate level of quality.
It is therefore necessary to enhance the data collected online with ‘offline’ data from catalogs, pricing sheets, official manufacturer source material; all in a unified, overall and multi-brand view.
Enhancement data:
- Tire Manufacturer Segment (Third party): Premium (1), Medium (2), Budget (3)
- Tire segment: Car performance, LT All-Terrain, CUV standard, etc.
- Season: Summer, Winter, AllSeason
- OE Marking: Audi, Mercedes, BMW, Tesla
- Technologies: Runflat, Seal, Noise-Dampening, etc.

Preparation and generation of the final data cube
The preparation step converts unified and enhanced data into a set of data (cube) that integrates your business rules, your internal data but also your vision of the market and your segmentation. Indeed, data on competitors’ prices is a key element in understanding the market but internal data is just as important.
Examples of business rules:
- Segmentation of tire manufacturers and trade organizations
- Aggregation of data by channel
- Aggregation of products by use
- Calculations on an identical scope of sizes
- Product clustering/segmentation
- Market Volume weighing
Examples of Internal data:
- Sales volumes
- Sell-in price data
- Profit margin
- OE fitment (Tire is original equipment on vehicle brands and models)
This is the step where the accuracy and consistency in the collection of online data is of particular importance. Indeed, to make sense of these 2 data sets, the granularity of online data must be at the same level. As such, these 2 data sources will be matched at the same level in order to compare the same elements.
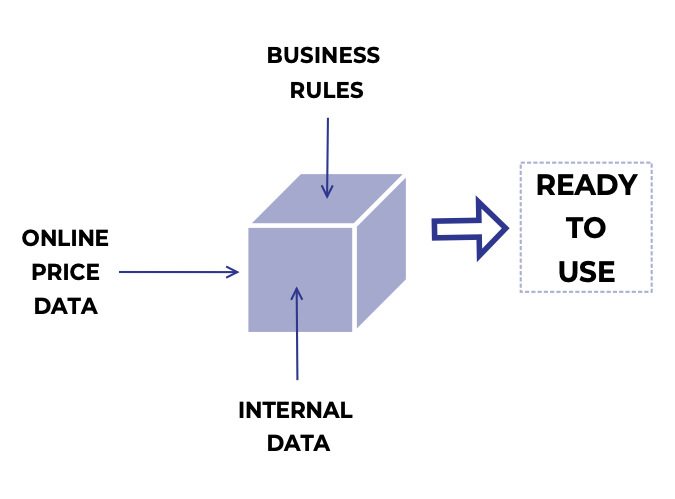
This is the last step before starting to ‘consume’ data in business tools.

Data analysis and extraction of findings
This is the last step.
It is now the time to inject data into one or several tools to work on it in various ways: analysis, simulation, modeling, monitoring, extraction of findings, decision making, etc.
However, before injecting it; it is crucial to choose the right tool(s) to maximize the use of data and adoption, but above all, provide a precise answer to the business questions asked at the first step.
How?
By establishing the profile of the data users as well as the intended uses: this is the user persona. His profile is built through a few simple questions:

- What is their background? Technical, Non-technical.
- What is their level of maturity / knowledge with respect to the data? Beginner, expert, etc.
- What is their function? Price Analyst, Data Scientist, Statistician, etc.
- What are their objectives? Study, monitor, decide, etc.
- Who are their studies for? Management, Sales, Marketing, etc.
- What is the frequency of use? Daily, weekly, monthly.
Depending on the users’ personae, preference will be given to:
- A Data Science tool to handle and create views and data cubes, create scenarios and simulate them, compare scenarios, etc.
- A Business Intelligence tool which will perform “data discovery” and extract findings: advanced filtering, data mining, construction of indicators, etc.
- A Data Visualisation or dashboarding tool to share findings, make decisions quickly or manage an activity on a daily basis.
Why you should trust us with this methodology for analyzing sell-out prices in the tire market?
Lizeo Group supports its customers in their data-driven digital transformation and has been collecting tire price data online on a daily basis for more than 10 years on over 1000 e-commerce sites worldwide.
This represents approximately 11.5 Million price lines per day, in all currencies, which are cleaned, matched, enriched and ready to use.